
A browser extension acts through the permissions granted in the browser profile where it is installed. A Chrome DevTools Protocol connection attaches to a specific browser endpoint and then selects a target. If you need to reuse a signed-in page, the first question is which profile and tab the connector can actually reach. The same URL can be open in two profiles with different state.
A developer trying to use Canva through Claude and Playwright MCP reported getting a fresh Chromium instance with an empty session. r/ClaudeAI
Key takeaways
Use a reviewed extension for an existing signed-in tab when someone can supervise the connection.
Use direct CDP with a dedicated profile for repeatable jobs that own the browser and its lifecycle.
An extension can use CDP internally. Review how it grants access and who can reach its connector.
Before a write, confirm the endpoint or grant, the visible workspace and what you expect to change.
How the connection starts
An extension is installed in a browser profile. Its manifest and any user-granted permissions determine which APIs and sites it can access. A connector can ask the user to choose a tab or use a temporary permission such as activeTab. That permission starts from a user invocation and normally ends on cross-origin navigation or when the tab closes. Some extensions request broader privileges. Review the installed connector rather than assuming all extensions have the same scope.
Extension permissions · activeTab · Playwright browser connection modes · Extension debugger API
Treat the transport and permission as separate
An extension can itself use a debugging API if it requests the relevant permission. Some tools use an extension as a bridge into a CDP-backed implementation. The useful comparison is therefore how the connector is authorized, how it chooses a target and what can reach it. The transport name alone does not answer those questions.
In an agent deployment, check three things separately: who can invoke the connector, what the browser lets it do, and which account is present in the target. Chrome’s extension debugger API supports a subset of CDP domains. A direct debugging endpoint has its own reachability and target controls. Choosing a tab in the client does not reduce what other clients that can reach that endpoint may request. Chrome debugger
For a supervised session, follow the steps to Connect an existing browser. The guides to Browser for an agent and Browser agent cover the tools you can place around that connection.
What CDP attaches to
CDP is a debugging protocol with browser and page targets. An address or WebSocket URL points to an instance that was configured to accept the connection. It does not identify whichever browser window looks active on the desktop. After connecting, enumerate targets, select the expected tab, and verify a visible state before sending a write. Different browser versions, connection methods and enterprise policies affect what can be attached.
CDP protocol · Chrome remote debugging change
Chrome 136 and later require a non-default user data directory when using the remote debugging port or pipe switches with regular Chrome. Chrome recommends Chrome for Testing for automation. For a remote worker, keep the endpoint on a private transport and restrict who can connect. A port that answers on loopback belongs to the host running the browser. Chrome
A developer using Playwright and CDP to configure extensions reported losing the connection after the Chrome 136 update. That is a deployment report from one project. Use the Chrome announcement to check the rule for your own browser. r/Playwright
| Decision | Extension | CDP |
|---|---|---|
| First approval | Review API and site permissions | Approve endpoint and profile owner |
| Target selection | Confirm permitted tab | List targets and verify visible state |
| Cleanup | Revoke grants or close selected scope | Close the owned browser and endpoint |
To reproduce an intermittent failure, separate the browser launch from the connection step. See Browser automation for the broader workflow and Debug with Chrome DevTools for debugging the page.
What the extension grant covers
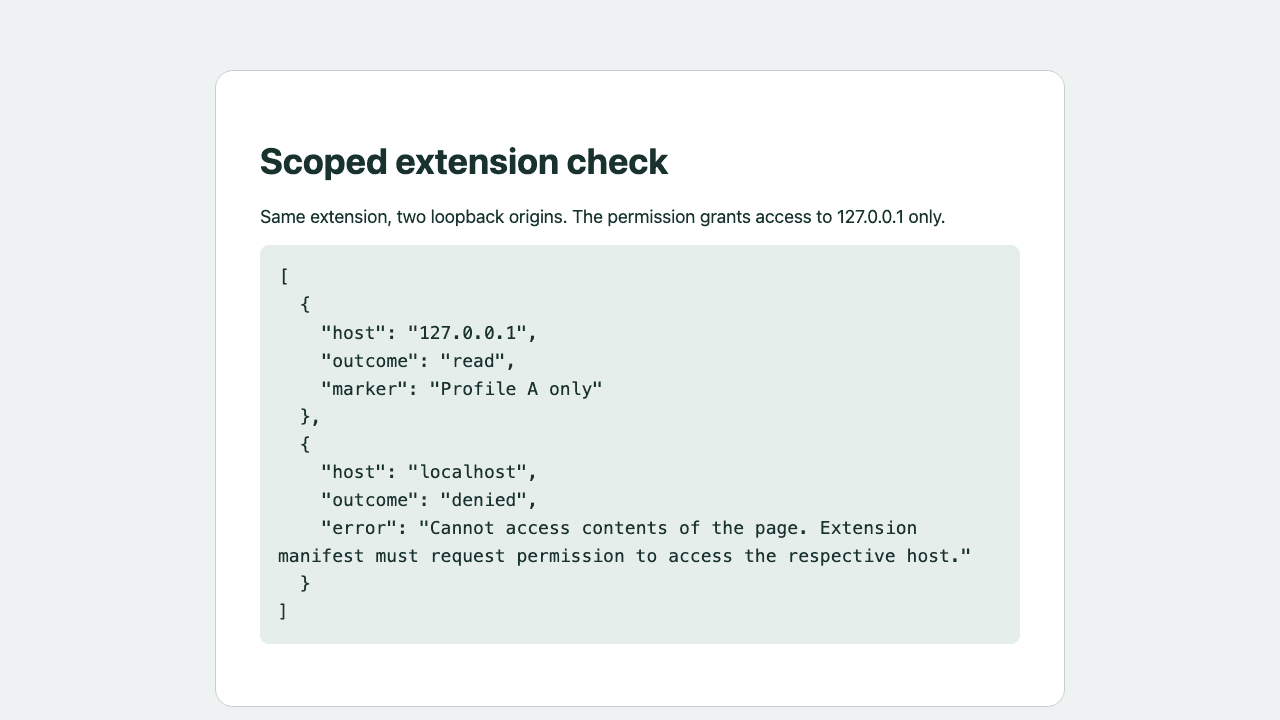
The archived fixture below illustrates host matching. It shows a script reading a synthetic marker at 127.0.0.1 and a denial at localhost. Both names reached one service, but the manifest granted only one host. Treat this as an example of host permissions. An extension with a different manifest can have a wider scope.
{
  "manifest_version": 3,
  "permissions": ["scripting"],
  "host_permissions": ["http://127.0.0.1/*"]
}
How to verify the CDP profile
The second archived fixture image shows a synthetic marker in a dedicated profile. When two instances open one URL, compare a visible workspace label with the expected value before editing. A successful handshake confirms that the endpoint answered. Check the tab separately.
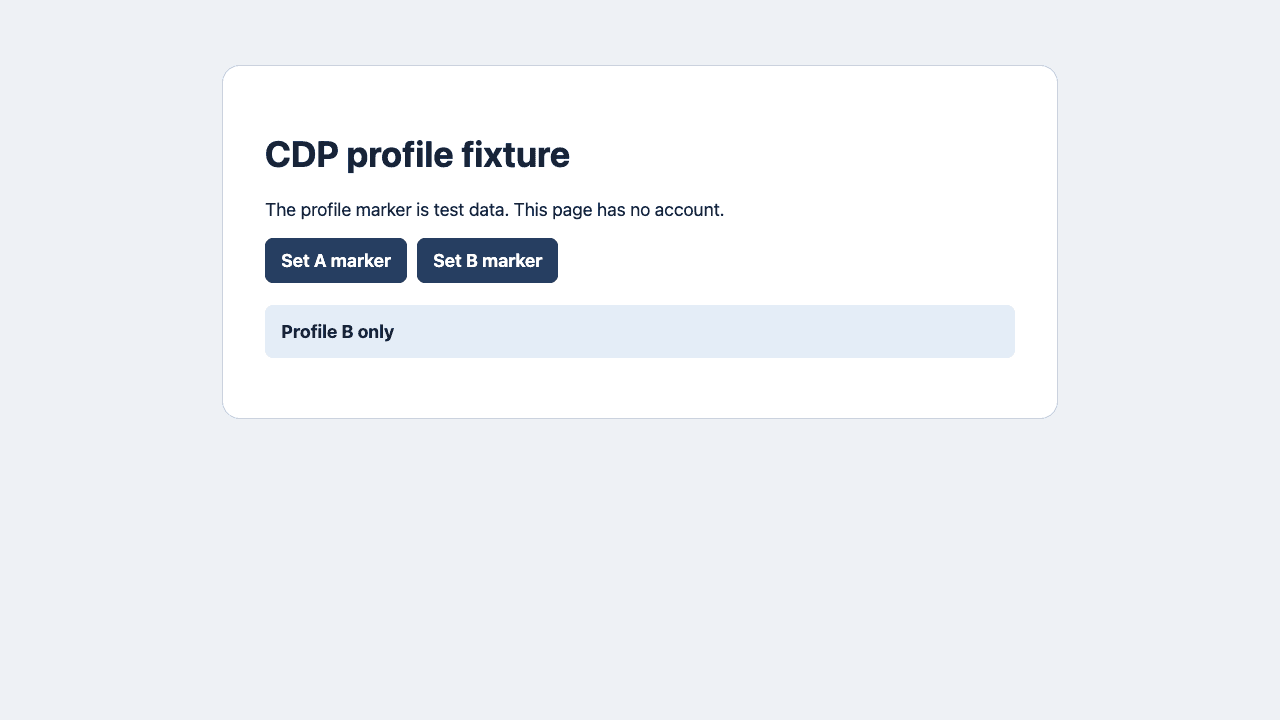
If you assign named profiles to recurring jobs, see agent-browser CLI sessions for an example of making session selection explicit.
Choose by ownership and exposure
For a human-supervised task in an already open tab, evaluate an approved extension with narrowly granted site access and a visible tab selector. For an unattended QA run, start an automation-owned browser with a dedicated profile, keep the debugging endpoint on a trusted local or managed transport, and close the session after use. If a remote worker runs the client, loopback there identifies the worker, so do not assume it reaches a laptop.
| Scenario | Fit to evaluate | What to verify first |
|---|---|---|
| Human reviews one existing tab | Approved extension with limited grant | Visible tab and site scope |
| Repeatable background QA | Dedicated CDP browser | Endpoint locality and a disposable profile |
| Policy denies access | Approved deployment path | Administrator’s permission and test account |
Use the Browser automation agent guide to plan unattended jobs and the Browser agent security guide to review approval and access before rollout.
Check before any write
Confirm the allowed domain, exact target tab and observable account or test marker. Review who can reach the debugging endpoint or grant an extension new permissions. If an enterprise policy blocks either method, stop and use the deployment path approved by the browser administrator. Recheck the expected result after navigation or action. A successful connection or click is only one part of the receipt.
Use a receipt before and after
For each connection, write down the expected browser owner, allowed host and visible marker. Check them with a read-only action. After changing state, read the target again. If it is the wrong instance or the scope is denied, reconnect or stop before trying a write. Keep results separate from the task prompt so another operator can inspect them.
The First-task checklist turns those checks into a small read-only trial before you grant permission to write.

FAQ
Does an extension automatically get every tab?
No. Access depends on its API permissions, site grants, user interaction and browser policy.
Does CDP attach to my current browser window?
It attaches to the endpoint you configured. Choose the intended target after connecting.
Can two profiles show different login state at the same URL?
Yes. Separate profiles can keep different cookies or storage for the same URL. Verify the visible workspace or account before changing data.
What changed in Chrome 136?
Chrome documented that its remote debugging switches no longer work against the default Chrome data directory. Check the current Chrome guidance for your setup.
What if company policy blocks remote debugging?
Use a connector or isolated automation environment approved by your administrator.
What should I save as evidence?
Record the route, profile or tab check, scope, observed result and cleanup without including personal account data.