
Codex can inspect browser console errors and failed requests when its client has a connected tool that exposes those signals. Chrome DevTools MCP provides that connection to a Chrome instance. The useful debugging sequence is to reproduce the fault, match the console message to a request, edit the responsible code, then rerun the same browser check.
One Codex user on Reddit described repeatedly copying browser console errors back into the client. The workflow below gives the agent those observations directly.
The example below uses a local, no-account page. A spelling error in a fetch path gives the page an HTTP 200 document and an HTTP 404 API request. The browser screenshot, console message and network response each answer a different question.
Key takeaways
A registered MCP server is a setup check. Open a page and retrieve a snapshot to verify runtime access.
Compare the browser's actual request path with the route in the source.
Record the exact response and visible result before editing.
Repeat the original flow after a small fix, and confirm the request, console and page together.
Use an isolated browser for a local reproduction and remove sensitive data from reports.
Which browser evidence to collect
| Signal | Tool or view | What to record |
|---|---|---|
| Current page | Page list and snapshot | URL, selected page and visible symptom |
| Console | list_console_messages, get_console_message | Relevant error, message ID, source location if available |
| Network | list_network_requests, get_network_request | Method, path, status, request ID and safe response excerpt |
| Visual result | take_screenshot or snapshot | User-visible error or corrected state |
| Code | Codex project view | Fetch path and corresponding server route |
For a browser automation agent, a DOM snapshot can confirm what the page shows. Debugging adds another layer. A snapshot can show “Could not load preferences,” while Network shows which request failed. The browser automation guide explains the browser-action layer.
1. Connect Chrome DevTools MCP to Codex
In Codex CLI, register an MCP server using the official command form. For local debugging, the example pins the package used for the evidence and launches an isolated, headless Chrome. It also disables the MCP usage statistics and performance field-data integration.
codex mcp add chrome-devtools -- npx -y chrome-devtools-mcp@1.12.0 \
  --headless --isolated --no-usage-statistics --no-performance-crux
codex mcp list
Open a new Codex session after configuration and ask it to list pages and open a permitted local URL. The list command shows registration. A real page snapshot proves the tool reached the browser. See the OpenAI CLI command reference and the Chrome DevTools MCP repository.
The ChatGPT app's integrated browser has a separate full CDP setting under Developer mode. An organization may restrict it. Follow OpenAI developer settings for that connection path. If your task only needs page reading or clicks, a normal browser agent may already be sufficient. A virtual browser can also be appropriate when your tool and test server can reach each other.
2. Reproduce the broken request
Save the fixture source as preferences-fixture.cjs and run node preferences-fixture.cjs. It starts a loopback-only server and prints its local URL. Open that address with ?stage=before. The page requests an example theme and shows “Could not load preferences.”
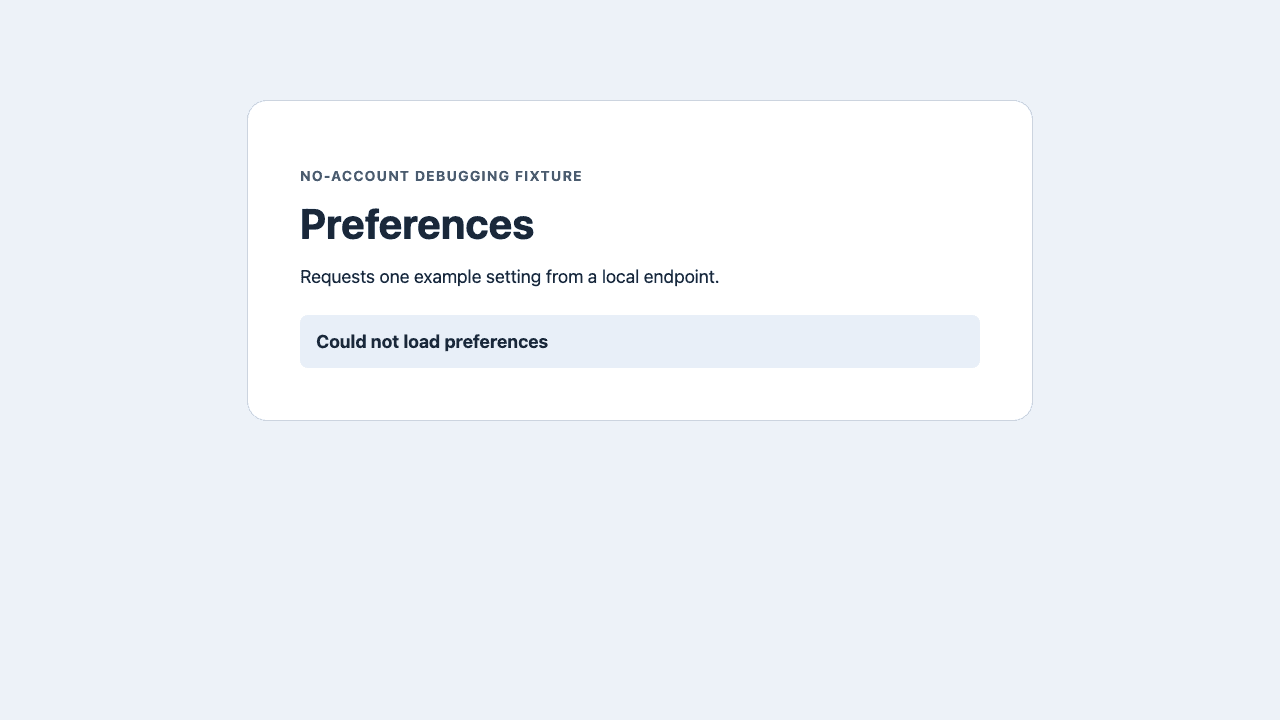
Ask Codex for the current URL, the visible symptom, the matching console message and the request details. The run for this guide used Chrome DevTools MCP 1.12.0 directly through a local MCP client. The Codex CLI configuration syntax was checked separately. The example does not rely on a Codex model's report for its test result.
Open the local fixture URL ending in ?stage=before. Wait until the
preferences status changes. Report the selected URL, visible status,
the relevant console message, and the failed GET method, path and HTTP
status. Inspect its request ID. Keep all actions on this local origin.
3. Match the console message to the network evidence
The document loaded with HTTP 200. The request GET /api/prefences returned 404. The response said unknown route. The console logged [preferences] GET /api/prefences failed: HTTP 404. All of those signals point to the misspelled route in the fetch call. A generic “failed to load resource” message alone would leave the request ambiguous.
Use the request ID for details after matching method and path. IDs belong to the captured navigation and may change on a later run. If you find a CORS problem, timeout, redirect or 401 instead, do not apply the spelling fix. First verify which of those conditions you actually observed.
4. Correct the path and rerun
The fixture's ?stage=after variant changes the endpoint to /api/preferences. It uses the same server and page markup. In a real app, correct the request path in the relevant source file, then replay the original action in the same test environment. Wait for an explicit UI condition rather than a fixed pause.
| Acceptance check | Before | After |
|---|---|---|
| Document | HTTP 200 | HTTP 200 |
| Data request | GET /api/prefences, HTTP 404 | GET /api/preferences, HTTP 200 |
| Console | Preferences request failed | Info message confirms light theme loaded |
| Visible page state | Could not load preferences | Theme: light |
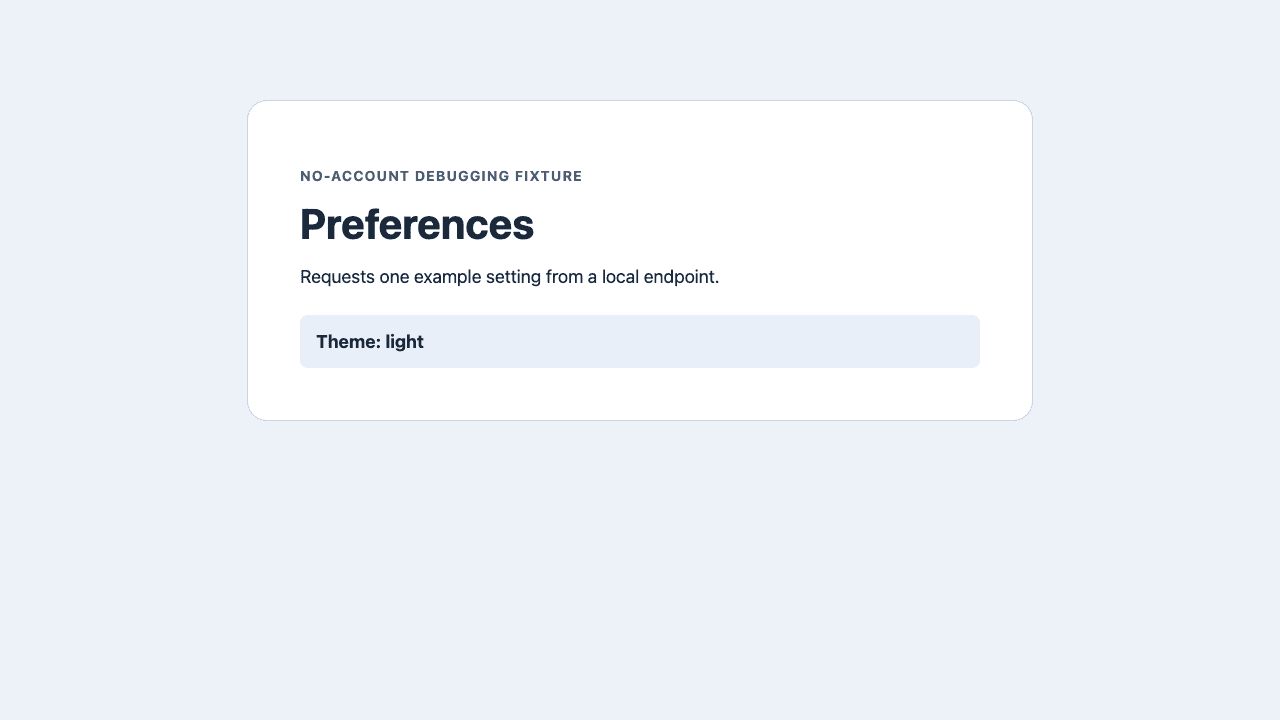
If Network is green and the UI is still wrong, keep debugging. The response may have the wrong data or the view may ignore it. Ask for the specific screen or element that should change. The first browser-agent task checklist offers a general way to set a visible acceptance condition.
Keep diagnostics inside the test context
An attached Chrome profile can expose signed-in pages and request details. An isolated browser can still make network calls, so use a permitted local or test origin. Collect only the relevant console messages and request details, and leave cookies, credentials and private response data out of any exported report. See the agentic browser security guide.
Another developer wanted to inspect the same browser session used for manual testing. That is a separate need from reproducing a public or local bug in a clean profile.
Use Tabbit Browser when the job is reading and acting on web pages in the same browser. For a DevTools-specific request, check which integration actually exposes Network and Console data. The Tabbit versus Codex guide explains the product roles, and how Tabbit works covers page context and task execution.
A useful fix report can be short. Include the failing request, the smallest source change and the browser evidence that the original symptom is gone.

FAQ
Can Codex read the Chrome console?
Yes, if its client has a connected browser tool that exposes console messages. Chrome DevTools MCP includes tools to list console messages and inspect an individual message in the selected page.
Can Codex inspect a failed network request?
Chrome DevTools MCP can list requests from the selected page and inspect a request by its ID. Match the URL, method and status to the action that caused the error.
Why does my page return 200 while an API call returns 404?
The document and its later API requests are separate HTTP transactions. A working HTML response does not prove that the JavaScript fetched the right endpoint.
Do I need to use my signed-in Chrome profile?
No. For a reproducible local bug, a new isolated Chrome process is usually enough. If a bug requires authentication, use a permitted test profile and avoid sharing sensitive request contents.
Is Chrome DevTools MCP the same as full CDP access in the ChatGPT app?
They are different connection paths. Chrome DevTools MCP is a separately configured server. The ChatGPT app has its own full CDP setting and organization policies.
What proves the fix?
Repeat the original action, check the relevant request and console output, and confirm the intended visible result. In this fixture the correct endpoint returns 200 and the page shows Theme: light.