
Chrome DevTools MCP lets an agent inspect a rendered page, read console messages, inspect requests and capture performance traces. Use those signals to follow one symptom back to the request or code that caused it. In this tutorial, a local button fails to load records. We reproduce it, change one fetch path and verify the result.
Choose a browser connection
Use a fresh isolated instance for an unfamiliar app or test fixture. The official tool also supports attaching to a debuggable browser via browserUrl or wsEndpoint, and documented autoConnect for a supported Chrome setup. Existing sessions can expose signed-in pages and storage. Limit the scope to an authorized profile and test origin. Our local run used the explicit Tabbit Browser Dev executable with an isolated profile. This is an observed custom runtime, not an official support claim for all Tabbit versions.
Register the pinned MCP server and start the fixture
Use the client’s local stdio MCP configuration. Our test used chrome-devtools-mcp 1.12.0 with the explicit browser path shown below. Adjust that path to your environment. We disabled server usage statistics and CrUX lookups for the local test. Download both files into one test directory, run the Python server, then open its printed loopback URL through the MCP tools.
{
  "mcpServers": {
    "chrome-devtools": {
      "command": "npx",
      "args": [
        "-y",
        "chrome-devtools-mcp@1.12.0",
        "--executablePath",
        "/Applications/Tabbit Browser Dev.app/Contents/MacOS/Tabbit Browser Dev",
        "--isolated",
        "--headless",
        "--viewport=1000x565",
        "--usageStatistics=false",
        "--performanceCrux=false"
      ]
    }
  }
}python3 fixture.py --port 8765Reproduce and collect two kinds of evidence
Open the page, take a snapshot and click Load records once. Capture the actual pageId and element uid from your tool results. The page showed Could not load records. list_console_messages recorded F02 load failed: HTTP 404. list_network_requests filtered to fetch returned GET /api/record [404]. get_network_request confirmed the failed request. A favicon 404 appeared separately and was not the application failure.
| Step | Tool | Expected result |
|---|---|---|
| 1 | take_snapshot + click | Could not load records |
| 2 | list_console_messages | F02 load failed: HTTP 404 |
| 3 | list_network_requests + get_network_request | GET /api/record [404] |
Chrome DevTools MCP · Tool reference
Change one path and verify the same action
The fixture server provides /api/records, while the script calls /api/record. Change the fetch path in fixture.html to /api/records and save. Reload the same page, take a fresh snapshot and click the same control once. The corrected network request returned 200 and the page read Loaded: F02-FIXED. The specific application console error did not recur. Keep the before and after receipts together so the result can be audited.
- const response = await fetch("/api/record");
+ const response = await fetch("/api/records");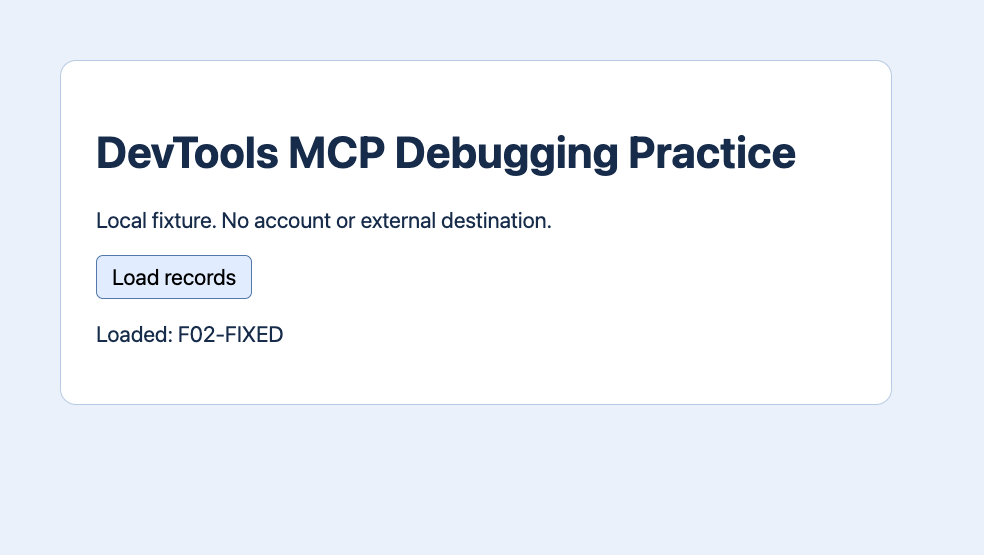
Use the performance trace for a separate question
After the functional check, we ran performance_start_trace with reload and autoStop on the repaired page. The local lab result showed LCP 386 ms, TTFB 2 ms and CLS 0.00, with no CPU or network throttling and no field data. This single reload was a trace capture exercise. It cannot establish a before-and-after speedup. When investigating a slow page, keep the workload and environment constant and repeat the sample.
| Tool | Expected result |
|---|---|
| LCP | 386 ms |
| TTFB | 2 ms |
| CLS | 0.00 |
What two user reports add
One r/ClaudeAI user described using network and console together to distinguish a missing resource from another exception. One r/mcp user reported that an MCP-launched browser behaved much slower than their regular browser. These are individual setups. They explain why you should preserve a precise request receipt and browser mode, and measure performance separately.
Can it connect to a running browser?
Yes, when the browser has an authorized debug endpoint and your environment supports the connection. Start with isolation unless the problem requires an existing session.

FAQ
Can it connect to a running browser?
Yes, when the browser has an authorized debug endpoint and your environment supports the connection. Start with isolation unless the problem requires an existing session.
What can Chrome DevTools MCP inspect?
Chrome DevTools MCP lets an agent inspect a rendered page, read console messages, inspect requests and capture performance traces. Use those signals to follow one symptom back to the request or code that caused it. In this tutorial, a local button fails to load records. We reproduce it, change one fetch path and verify the result.
How do I register the server?
Use the client’s local stdio MCP configuration. Our test used chrome-devtools-mcp 1.12.0 with the explicit browser path shown below. Adjust that path to your environment. We disabled server usage statistics and CrUX lookups for the local test. Download both files into one test directory, run the Python server, then open its printed loopback URL through the MCP tools.
How do I verify the fix?
The fixture server provides /api/records, while the script calls /api/record. Change the fetch path in fixture.html to /api/records and save. Reload the same page, take a fresh snapshot and click the same control once. The corrected network request returned 200 and the page read Loaded: F02-FIXED. The specific application console error did not recur. Keep the before and after receipts together so the result can be audited.
What does one local trace establish?
After the functional check, we ran performance_start_trace with reload and autoStop on the repaired page. The local lab result showed LCP 386 ms, TTFB 2 ms and CLS 0.00, with no CPU or network throttling and no field data. This single reload was a trace capture exercise. It cannot establish a before-and-after speedup. When investigating a slow page, keep the workload and environment constant and repeat the sample.