
A browser updates, one familiar website stops working, and the obvious conclusion is that the update broke it. Sometimes that is correct. Often the update is only the last visible event before a cache conflict, extension failure, site deployment, account problem, or network change finally surfaces.
The usual fixes can make matters worse before they make anything clearer. An Opera user reported that Pinterest initially showed only a few pins; after following advice to clear cache and cookies, the site became a blank page. The action changed the symptom without locating the cause.
A controlled test is safer. Change one variable, record the result, and follow the failure when it moves. Tabbit Browser can provide a clean second-browser comparison and keep the page, screenshot, and notes together. It is not a repair button. Because it is Chromium-based, it cannot replace a Firefox or Safari engine check.
Key takeaways
"It broke after the update" is a useful timestamp, not proof of causation.
Test scope before deleting data: one site or many, one profile or every profile, one browser or every browser, one network or every network.
If a private window works, investigate extensions and site-specific data before resetting the browser.
A second Chromium browser isolates profile problems. Firefox or Safari adds a real cross-engine test.
Do not downgrade a personal browser as a first response. Preserve security updates and collect a reproducible report instead.
Diagnosis at a glance
| Controlled test | Result | Most likely scope | Best next step |
|---|---|---|---|
| Open another website in the same browser | Other sites also fail | Browser, device, network, firewall, or DNS | Restart the browser, then test another network or device |
| Open the affected site in a private window | It works | Extension, cookies, cache, or profile settings | Disable extensions, then remove data for that site only |
| Open the site in a fresh second browser | It works | Original browser profile or browser-specific behavior | Compare extensions, permissions, and version details |
| Open the site in Firefox or Safari | It works there but fails in Chromium | Blink-specific behavior, Chromium policy, or local Chromium setup | Test a clean Chromium profile and report exact versions |
| Open the site on another device and network | It fails everywhere | Website, account, region, or server | Check the service status and contact the site owner |
| Sign out or use another account | Only one account fails | Account state, experiment, permissions, or stored session | Contact the service with account-safe reproduction details |
This table is a routing tool, not a verdict. A site may have more than one defect, and a private window also changes several conditions at once. The next steps narrow those conditions further.
Why an update can appear to break a website
Browser updates change more than the interface. They can alter the rendering engine, JavaScript runtime, cookie handling, certificate checks, media support, GPU paths, extension APIs, and security enforcement. A website that relied on an old behavior may expose a real compatibility defect after the update.
But the browser is only one layer. The website may have deployed new code that morning. A service worker may combine an old cached bundle with new HTML. An extension may update independently. Antivirus software can begin filtering a request. The account may enter an experiment that other users do not see.
Calling every problem "browser bloat" does not help with a single broken page. If the whole app feels slow or cluttered, the causes in our browser bloat guide are relevant. If one page alone has broken controls, start with isolation.
The distinction matters because each cause belongs to a different owner:
same site + every browser + every network = probably the site or account
same site + one profile only = probably profile state or an extension
many sites + one network only = probably network, DNS, firewall, or filtering
same site + one engine family = probably compatibility or engine policy
"Probably" is deliberate. These equations tell you where to investigate, not what code failed.
Step 1: capture the failure before changing anything
Write down the exact URL, time, browser name, full version, operating system, and the last action that still worked. Save the visible error text and a screenshot. If the page partly loads, note what is missing: images, login, video, buttons, fonts, or the entire document.
Also record whether the failure affects one account and whether important unsaved text is still in the page. Do not clear data while a draft, cart, form, or offline document may live only in local storage.
This short record prevents a familiar support dead end: "It is broken now, but I already reinstalled everything." A Chrome user described trying rebooting, reinstalling, changing QUIC, flushing data, and clearing DNS, yet no other browser had the problem. With that many variables changed, the useful trail was gone.
If you plan a reset anyway, first use the browser backup checklist for bookmarks, passwords, and open work.
Step 2: establish the scope
Open two known-good websites in the same browser. Then open the affected site on another device. If possible, test once on a different network, such as a phone hotspot.
The goal is not to collect every possible combination. You need enough contrast to answer four questions:
Is one site affected or many?
Is one browser affected or all browsers?
Is one device affected or all devices?
Is one network affected or all networks?
When several unrelated sites fail on one network, changing page cache repeatedly is wasted motion. Look at DNS, proxy, VPN, firewall, antivirus, or captive portal conditions. When one site fails everywhere, check its status page or support channel.
Do not disable security warnings just to make a test pass. Certificate, malware, HSTS, and mixed-content warnings are evidence. A more secure browser setup should keep those protections in place while you diagnose the underlying problem.
Step 3: use a private window as a branch, not a cure
Google's official Chrome loading-error guide recommends opening the affected page in Incognito mode. If it works there, Google sends you next to extensions and browsing data. That is the right interpretation.
A private-window pass means the normal profile deserves attention. It does not mean "cookies were definitely corrupt." Private mode changes stored sessions and often extension behavior, and it starts without much of the page state that has accumulated in the regular profile.
If the private window fails in exactly the same way, keep going. You have ruled out some profile conditions, not the browser, network, or website.
Step 4: isolate extensions one at a time
Start with extensions that can read or change the affected site: ad blockers, privacy tools, script managers, password managers, coupon tools, VPNs, downloaders, dark-mode tools, and developer helpers. Turn them all off, reload, then restore them one at a time until the failure returns.
The order matters. If you remove five extensions, clear all data, and reset flags in one pass, a working page teaches you nothing.
An occasional summary or writing extension may be all you need for normal browsing; our Chrome AI assistant guide covers that lighter setup. For diagnosis, even a trusted extension is still a variable. Temporarily disabling it is a test, not an accusation.
Step 5: delete data for the affected site only
Clear the smallest possible scope. Remove the affected site's cookies, cached files, permissions, and service-worker storage only after you have saved unsent work and accepted that the site may sign you out.
Then close every tab for that site, reopen one new tab, and sign in again. This avoids testing a mixture of old in-memory state and new storage.
If the site begins working, do not stop at "cache issue" if you own the site. Record which storage was removed and inspect cache headers, service-worker updates, asset versioning, and cookie changes. The bug may return for every user who holds the same stale state.
If removing site data changes the symptom but does not fix it, that is still evidence. Keep the before and after screenshots in the report.
Step 6: test a clean profile and a second browser
A fresh profile is the best check for browser configuration. Do not sign in, sync settings, or import extensions before opening the affected URL. If the page works, add your normal pieces gradually.
A second browser is even faster when you already have one installed. One Opera user found Pinterest would load normally in Firefox after every suggested Opera fix had failed. That result shrinks the problem, but it does not yet distinguish an Opera profile problem from a Chromium-family issue.
Use both comparisons when the site matters:
A fresh Chromium browser or profile tests whether old local state follows you.
Firefox tests Gecko against Blink.
Safari tests WebKit on Apple platforms.
Our guide to using a second browser explains why this role works without forcing a full migration. If the test turns into a permanent switch, compare the trade-offs in the Chrome alternatives guide.
Step 7: decide whether the user or the site owner can fix it
You can fix local cache, extension conflicts, permissions, profile corruption, and some network settings. You cannot repair a server outage, a broken deployment, an expired certificate, an account-side experiment, or unsupported website code from the browser settings page.
For ordinary users, the stopping point is a clean reproduction plus a safe workaround. Send the site owner the browser version, OS, exact URL, time, screenshot, private-window result, second-browser result, and the shortest action sequence that triggers the failure.
For site owners, open DevTools before asking users to wipe their profiles. Chrome's Issues panel groups cookie problems, mixed content, CORS, Content Security Policy violations, stylesheet failures, and other affected resources. The Console and Network panels then show which scripts or requests failed.
Test features, not browser names. MDN recommends feature detection so a site can choose a supported path instead of guessing from a user-agent string. For a fuller development setup, see the developer browser guide.
A practical diagnostic workspace in Tabbit
Tabbit is useful here when you treat it as a controlled environment, not another pile of imported state.
Install Tabbit Browser and open the failing URL before importing history, bookmarks, settings, or extensions. The official site says Tabbit can import those items from Chrome, Edge, or Safari, but importing them at the start would contaminate the comparison. Keep the first run clean.
If the page works, you have an immediate fallback and evidence that the original profile or browser path matters. If it fails, add the visible page or screenshot as context and ask for a reproduction note that separates observations from guesses:
Create a bug report from this page and screenshot.
Include the exact visible error, affected action, and page URL.
Do not infer a root cause.
List the next three tests that each change only one variable.
Tabbit's official product page confirms that pages, screenshots, highlights, and local files can enter the same request. The source stays beside the notes, which is more useful than copying a partial error into an unrelated chat window.
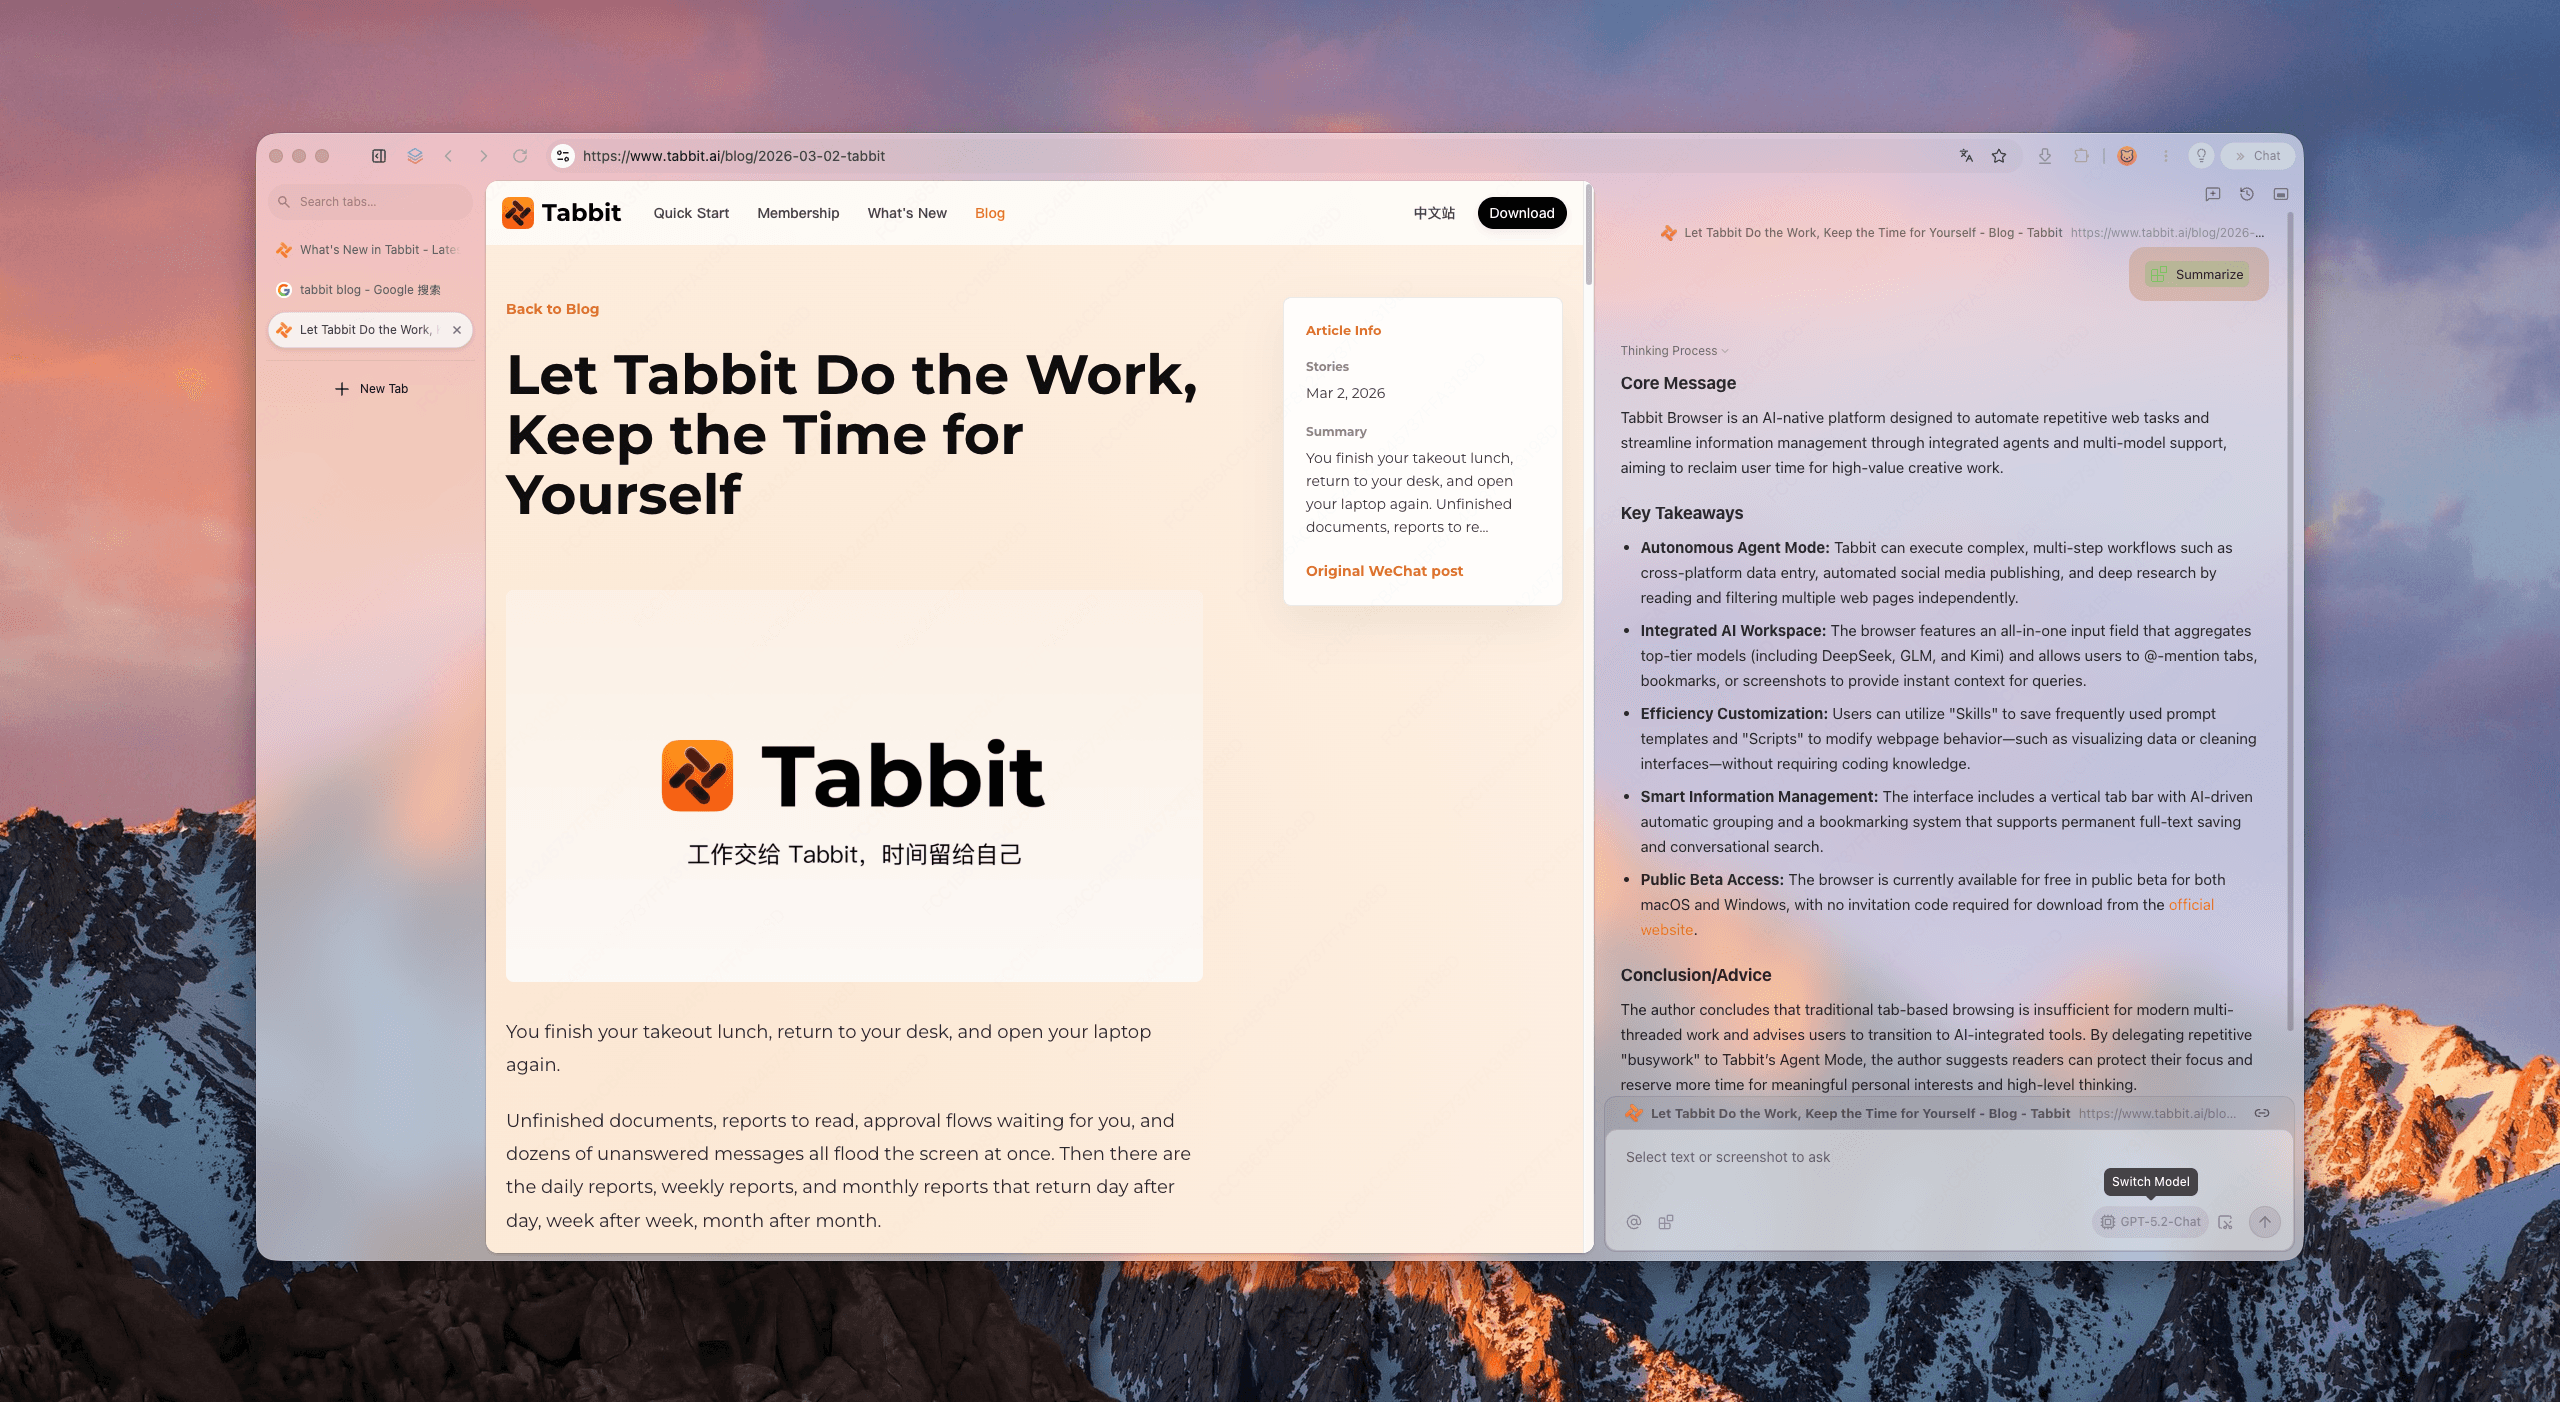
For a cosmetic problem on a non-sensitive page, Script Mode can produce a temporary local adjustment. The Tabbit team's browser practices article shows it correcting an article-width problem. Treat that as a patch for your view, not a repair to the website. Do not run generated page scripts on banking, checkout, password, admin, or other sensitive surfaces.
Agent Mode can repeat a bounded public-page checklist and collect visible outcomes, but it cannot test Firefox or Safari from inside Tabbit. It also should not submit forms, change accounts, or bypass security warnings during diagnosis. The wider browser automation safety guide explains why reviewable, reversible tasks are the right starting point.
Tabbit's limitation is important: it is Chromium-based. If Chrome and Tabbit fail identically, test Firefox or Safari before calling it a universal site defect. The Tabbit and Chrome comparison provides the broader product context.
Choose the next action by evidence
| Your evidence | Keep | Change next | Escalate to |
|---|---|---|---|
| Works in private mode only | Screenshot, URL, version | Extensions, then site-specific data | Browser support if no local cause appears |
| Works in a clean Chromium browser | Original profile untouched | Compare extension and permission state | Extension vendor or browser support |
| Fails in Chromium but works in Firefox/Safari | Exact engine versions and errors | Clean Chromium profile, then DevTools | Website owner with cross-engine reproduction |
| Fails on every browser and device | Account and service details, no passwords | Service status and another account if safe | Website owner or service provider |
| Fails only on one network | Browser state unchanged | VPN, proxy, DNS, firewall, captive portal | Network administrator or ISP |
| Cosmetic layout can be patched locally | Original screenshot and temporary script | Report the CSS/DOM symptom | Website owner; remove the patch after a fix |
Avoid endless resets. If a controlled test moves the failure, follow it. If three clean environments reproduce the same site defect, stop modifying your computer and report the site.
A bug report that someone can act on
Use this compact template:
URL:
First observed time and time zone:
Browser and full version:
Operating system:
Account state: signed in / signed out / unknown
Expected result:
Actual result and exact visible error:
Shortest reproduction steps:
Private-window result:
Fresh-profile result:
Second Chromium browser result:
Firefox or Safari result:
Other device/network result:
Screenshot attached: yes / no
Do not include passwords, session cookies, private documents, full console dumps with tokens, or account identifiers that support did not request. If the incident also involves missing tabs or bookmarks, preserve the evidence before changing sync; the browser sync troubleshooting guide covers that separate risk.
Final verdict
When a website stops working after a browser update, treat the update as the start of the timeline. Do not treat it as the final diagnosis.
Capture the failure, test scope, try a private window, isolate extensions, remove only the affected site's data, then compare a clean profile and another engine. That order keeps each result meaningful and limits collateral damage.
Tabbit is a practical first comparison for Mac and Windows users who want a clean Chromium browser plus page and screenshot context. Install it beside your current browser, run the failing URL before importing anything, and keep it if the separate workspace remains useful. Add Firefox or Safari when engine diversity matters, and report true website defects instead of trying to repair them with another reset.

FAQ
Can a browser update really break one website?
Yes, but timing alone does not prove it. An update can change rendering, security enforcement, cookies, codecs, or extension behavior, while a website deployment or stale local data can fail at the same time.
Why does the site work in Incognito mode?
That result usually points toward the normal browser profile, especially extensions, cookies, cached files, or site permissions. It does not identify the exact cause, so test those variables one at a time.
Should I clear all cookies and cache?
Start with data for the affected site, not the entire browser. Clearing all cookies signs you out of many services and can erase local state without proving which site caused the problem.
Is another Chromium browser a valid compatibility test?
It is useful for isolating profile and configuration problems, but it is not a complete engine test. Add Firefox or Safari when you need to compare Blink with Gecko or WebKit.
Should I downgrade the browser after an update breaks a site?
Most personal users should avoid downgrading. A rollback can remove security fixes and complicate profile data; managed organizations should only do it as a short, controlled test with an administrator.
How can Tabbit help diagnose a broken website?
Use Tabbit as a fresh second browser before importing extensions or site data, then compare the same URL and capture the visible error as page or screenshot context. Tabbit is Chromium-based, so a Firefox or Safari check is still needed for true cross-engine diagnosis.