
The fan gets loud, your battery drops quickly, and a video call starts to stutter. You open the operating system task manager and see Chrome near the top, but it still does not tell you which tab or feature is doing the work. That is the frustrating part of high Chrome CPU use: the browser name is visible, while the useful culprit is one level deeper.
Start with Chrome's own Task Manager. Press Shift+Esc on Windows, Linux, or ChromeOS, or choose Window > Task Manager on macOS. Sort by CPU while the symptom is happening. A named tab, extension, GPU Process, or browser service gives you a much better lead than ending random chrome.exe processes. One r/techsupport poster described hourly 100% spikes that stalled Chrome for five to ten seconds; a reply suggested sorting Chrome Task Manager by CPU, and the poster later traced the issue to a specific tab. (thread)
This guide separates CPU from RAM, network, and GPU symptoms, then tests one variable at a time. Tabbit Browser appears near the end as an option for reducing tab sprawl. It is not a CPU cleaner.
Key takeaways
Use Chrome Task Manager during the spike, not only the operating system's aggregate Chrome row.
Reproduce the same action after closing one tab or disabling one extension. A repeatable change is stronger evidence than a single percentage.
Video playback, captions, WebGL, animated feeds, page scripts, extensions, and background services can all create CPU work.
Hardware acceleration is a trade-off. Disabling it may expose the CPU to more rendering or decoding work.
Tabbit helps when too many live tabs make the workload hard to review. It cannot fix a broken page or extension.
Chrome CPU usage at a glance
| What you notice | What it points to | First check |
|---|---|---|
| One tab rises when you scroll or edit | Page script, animation, document, or embedded frame | Chrome Task Manager and the same action in a clean window |
| CPU rises only when video starts | Decoder, captions, ads, codec, or graphics path | Video tab, GPU Process, and hardware acceleration comparison |
| An extension stays busy with pages closed | Background service or extension bug | Disable one extension and restart |
| Chrome is high in the OS list but no tab is high | Browser process, service, driver, or another window | Chrome Task Manager plus OS monitor |
| RAM is high but CPU is quiet | Live page state or cache, not necessarily active work | Check memory pressure separately |
The distinction matters. Why Chrome can use so much RAM covers memory ownership. Why Chrome feels slow covers broader responsiveness. This article is about finding active CPU work.
Find the owner with Chrome Task Manager
Save forms, uploads, edits, and meeting notes before testing. Then open Chrome Task Manager and click the CPU column to sort it. Let the list settle for a moment, reproduce the lag, and watch which row moves with it.
Chrome may show a page title, an extension name, GPU Process, Browser, Network Service, or Service Worker. A page title is the easiest case. Close that one tab, reopen it, and repeat the same action. If the spike returns, the page is a credible suspect. It is still not proof that the page alone is defective, because an extension or driver may interact with it.
An extension row deserves an A/B test. Record the normal state, disable one extension at chrome://extensions, restart Chrome, and repeat the same pages. Do not turn off every extension if you need to identify one culprit. If a work profile is managed by an administrator, check before changing security or identity extensions.
If GPU Process is high, look at video, WebGL, canvas, animated dashboards, and multiple high-resolution surfaces. Chrome's DevTools Performance panel can record a page trace and show long tasks, scripting, rendering, and painting. It is a diagnostic aid for a page, not a promise that every CPU spike is a JavaScript bug.
Cross-check the operating system
Chrome Task Manager tells you which Chrome task is busy. The operating system tells you whether that work is affecting the whole machine.
On Windows, compare Chrome with the total CPU graph in Task Manager and note whether another application is the real source. On macOS, Activity Monitor's CPU view shows process CPU use, while its Energy view helps explain fast battery drain. Linux users can use their desktop system monitor or a process tool. Keep the sample short and tied to a repeatable action.
| Cross-check | If it is high | If it is normal |
|---|---|---|
| Chrome Task Manager CPU | Find the named row or service | The OS may be reporting another process |
| Total system CPU | Chrome is competing with other apps | The problem may be jank, network, or GPU output |
| GPU activity | Rendering or decoding path deserves a test | CPU is more likely doing the media or script work |
| Energy or battery impact | A sustained workload is draining power | A brief spike may be harmless |
| Network transfer | Ads, streams, sync, or downloads may be active | Network is less likely to explain the CPU spike |
Do not compare CPU percentages across tools as if they used the same denominator. Use them to answer different questions: which task is busy, and is the machine under pressure?
Isolate pages, video, and background work
Use this order so you do not destroy the session before learning anything:
Reproduce the symptom and note the top CPU rows.
Save work in the highest named page.
Close only that page, then wait and observe the system.
Reopen it in an Incognito window with extensions disabled where practical.
Repeat the exact action, such as starting a call, scrolling a feed, or playing the same video.
If the spike follows the page in a clean window, update Chrome and the site, test a lower video resolution, and report a reproducible issue if it remains. Do not make a universal claim from one video or one device. A recent r/buildapc discussion reported CPU rising to about 95% when YouTube playback began after a Chrome update, while stopping the video brought usage down. The author later described a flags-based fix and also considered switching browsers. (discussion) This is a personal report, not a benchmark, but it shows why playback should be tested as its own condition.
Captions and accessibility features can also be separate work. In the r/techsupport thread above, a commenter said Chrome's Live Caption service was responsible for high CPU on their setup. Treat that as a lead to test, not a general diagnosis.
For a page that remains busy while you do nothing, check DevTools Performance and the page's own settings. A live feed, animation, polling dashboard, collaborative editor, or meeting page may be doing exactly what it was built to do. If the tab is idle and still consumes CPU, extensions and background services move higher on the suspect list.
Extensions, updates, and security checks
Disable extensions in batches only for a quick yes-or-no comparison. To identify one, use binary isolation: disable half, repeat the test, then narrow the half that changes the result. Re-enable each extension after testing so you do not accidentally leave a password manager, blocker, or accessibility tool disabled.
Install Chrome updates from Chrome's own update screen and restart. A browser update can change video paths, page behavior, or extension compatibility, but “it started after an update” does not prove the update is the cause. Record the Chrome version, operating system, URL, and exact reproduction steps before filing a bug.
If CPU activity continues after closing all visible pages, inspect extensions, background apps, another Chrome window, and the OS process list. Remove extensions you no longer need. Scan for unwanted software using the security tools appropriate to your operating system. Do not download a “CPU optimizer” that asks for broad browser permissions as the first response.
Hardware acceleration: a controlled test
Chrome's hardware acceleration setting changes where some graphics and media work runs. The browser may use the GPU for compositing or decoding, while scripts and layout remain CPU work. Chrome's graphics documentation and the DevTools performance guide explain why the path can vary by content and driver.
If GPU Process is high, video is corrupted, or a driver issue is suspected, toggle hardware acceleration, restart Chrome, and repeat the same workload. Turning it off can increase CPU use, fan noise, and battery drain. Our hardware acceleration explainer and Chrome setting guide cover that trade-off. Restore the original setting if the symptom does not change or video gets worse.
A practical option for crowded sessions: Tabbit Browser
Sometimes no single task is runaway. The total comes from a research window with old dashboards, duplicate searches, meeting tabs, and pages you forgot to close. Diagnosis becomes harder because the tab strip hides the relationship between a page and a project.
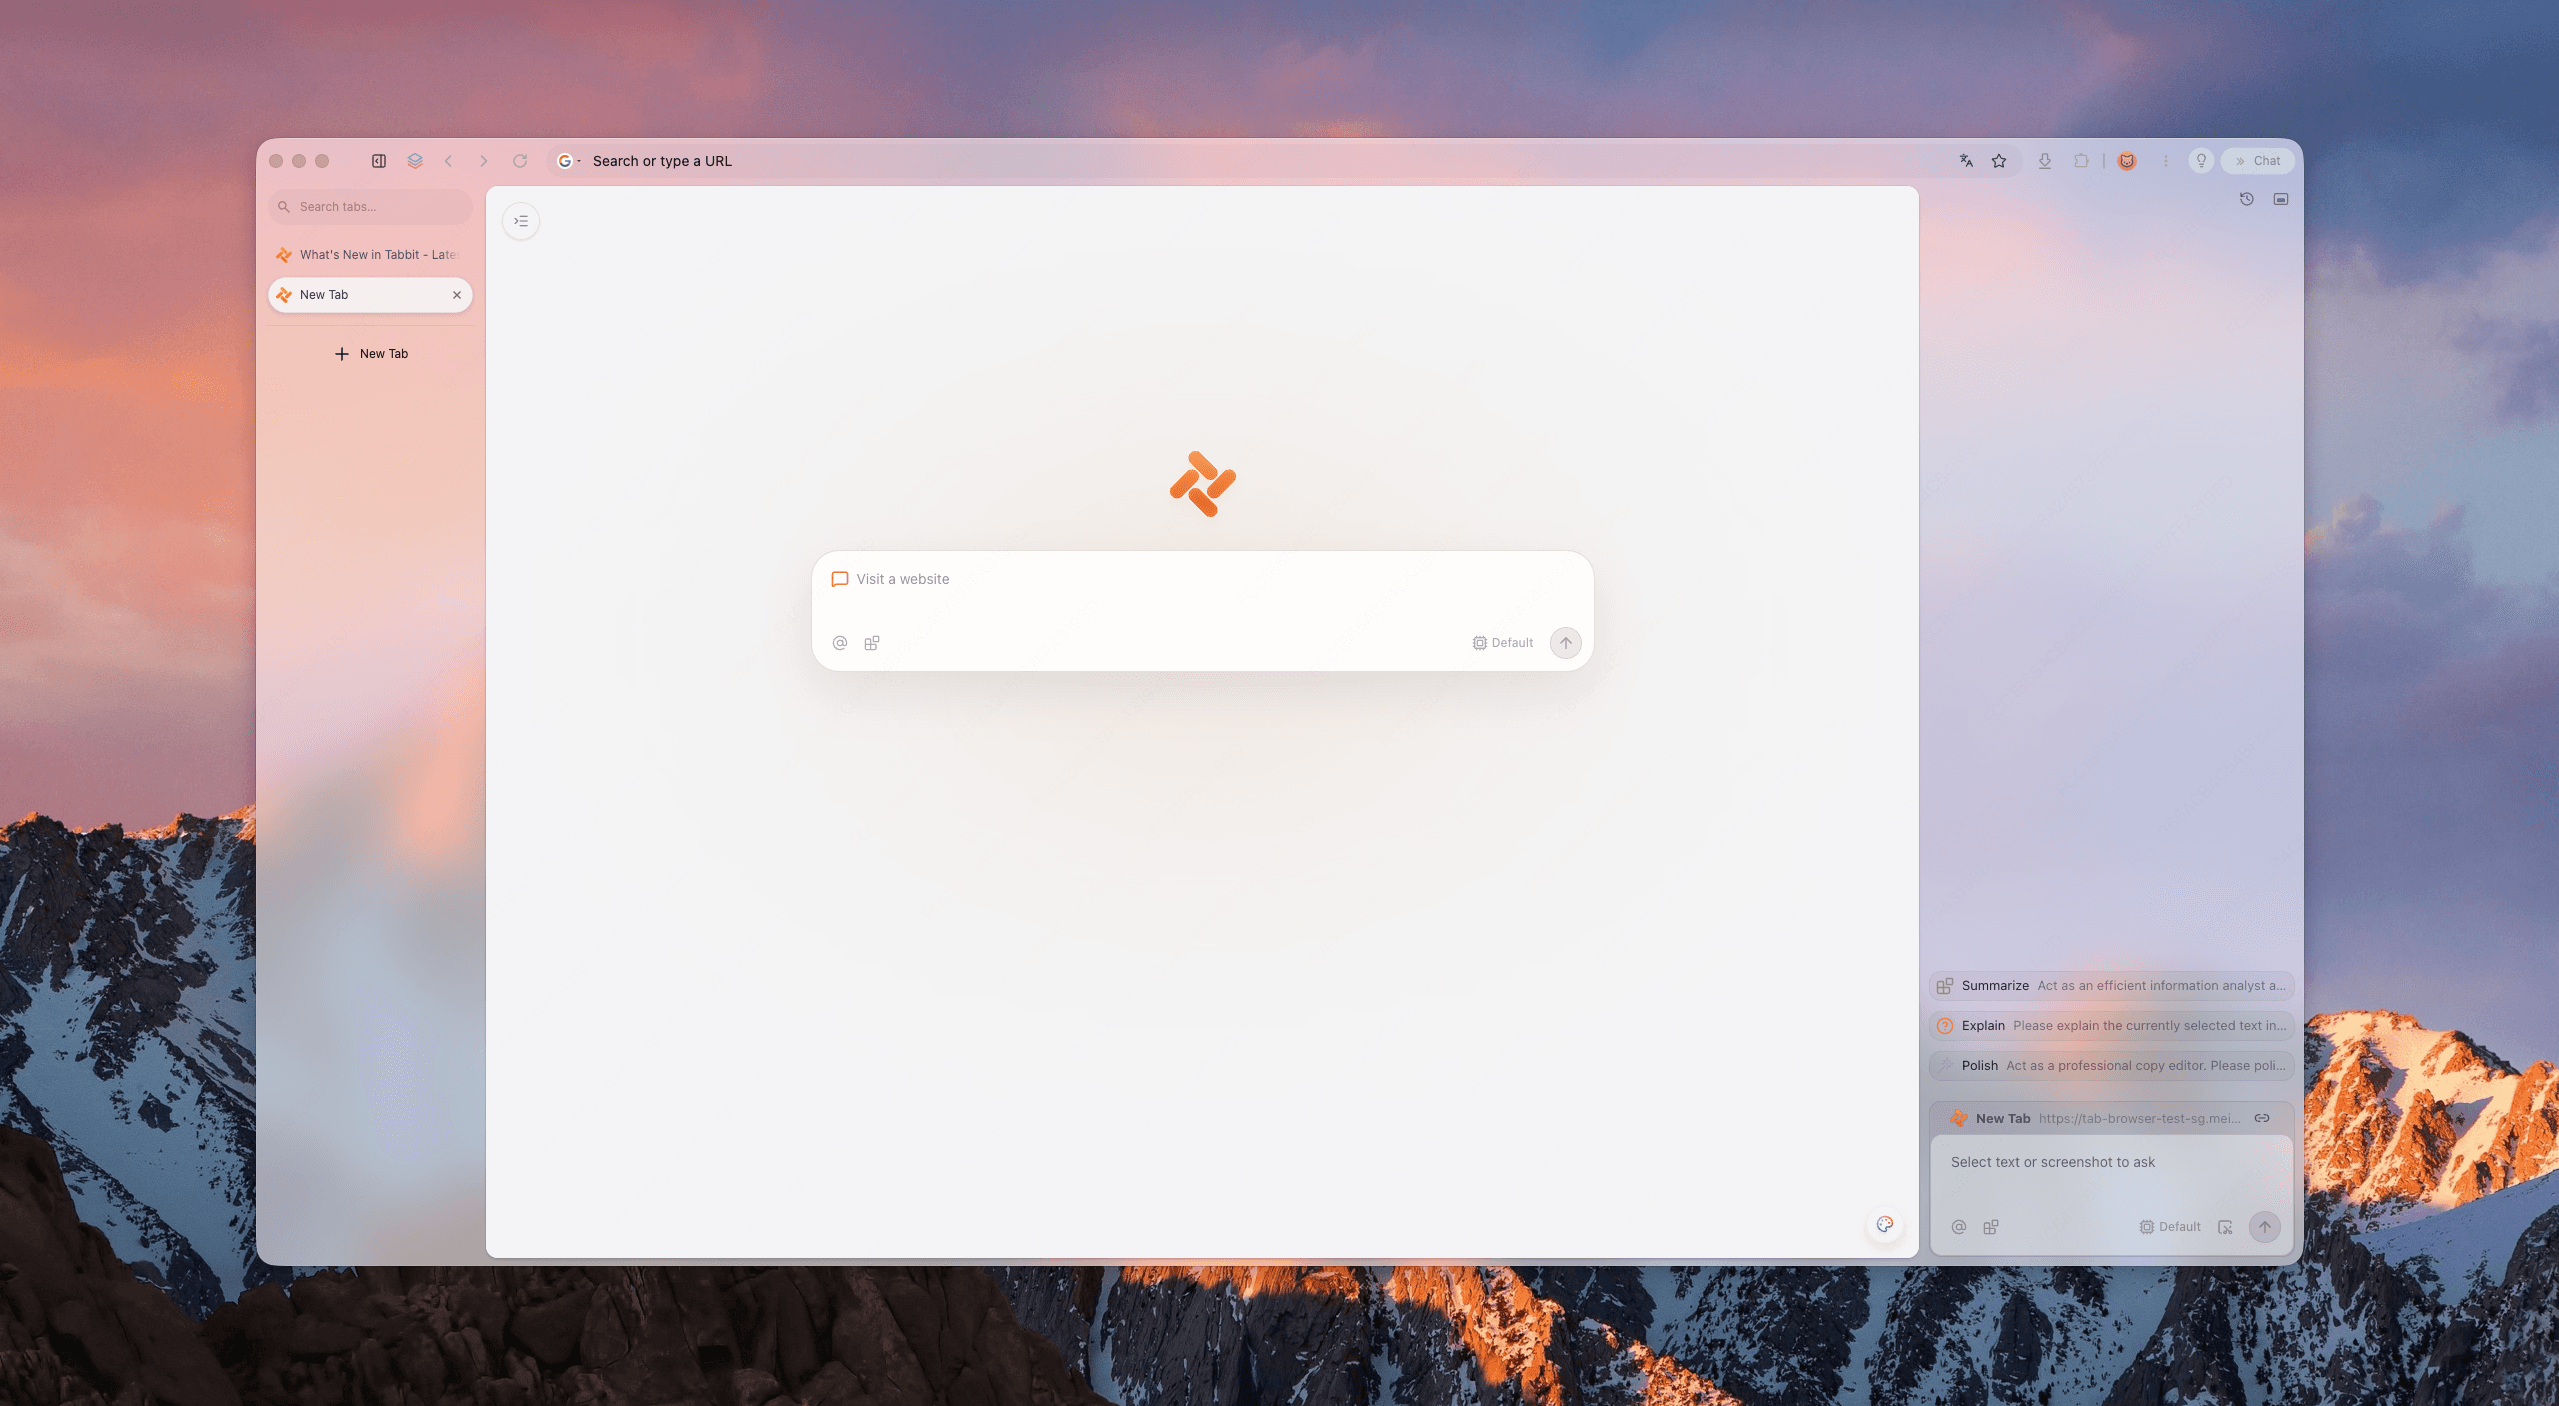
Tabbit Browser's sidebar keeps more tab titles visible, and Smart Tab Organization can group open pages by topic. The image below shows the Tabbit workspace and sidebar. Use organization after saving work, then review the groups before closing anything.
The safe workflow is simple: diagnose in Chrome first, import only what you need into a test Tabbit profile, organize one project window, close duplicates, then repeat the same workload. Tabbit can reduce the number of live pages you keep open, but it cannot make a demanding video, extension, or script use less CPU. It is also Chromium-based, so the same extension or page can still be a suspect.
For a broader organization workflow, see too many browser tabs, browser workspaces, and vertical tabs. For switching safely, use our Chrome data backup guide. These links solve session management, not page-level profiling.
Choose the next action
| Evidence | Next action | Tabbit fit |
|---|---|---|
| One page spikes during one repeatable action | Reproduce cleanly, update, and report if needed | Not the primary fix |
| One extension remains busy | Disable, update, replace, or remove it | Only if you leave the faulty extension behind |
| Video or captions trigger the spike | Test decoder, captions, extensions, and acceleration | Useful for organizing other work, not decoding |
| GPU Process is high | Compare acceleration and drivers | Not a driver repair |
| Many ordinary tabs keep the CPU busy | Close expired work and keep active projects separate | Yes, Smart Tab Organization can help review |
| Every clean browser shows the same system pressure | Check other apps, malware, drivers, and hardware | No browser can add CPU capacity |
When to escalate
Escalate to the site or Chrome issue tracker when a clean profile reproduces the same spike, the steps are stable, and the issue survives a restart and update. Include the browser version, operating system, a safe minimal URL, the exact action, and a screenshot or trace with private data removed.
Ask for IT help when the browser is managed, the page handles company data, or the process list suggests malware. If the machine is slow across browsers and other applications, stop treating it as a Chrome-only problem.
Final verdict
Chrome using too much CPU is a clue, not a diagnosis. Catch the spike in Chrome Task Manager, match it to a page or feature, confirm it with the operating system, and change one variable at a time. Keep CPU, RAM, network, and GPU evidence separate.
If one page, extension, caption service, or graphics path is responsible, fix that owner. If the load is the sum of a crowded session, Tabbit Browser can make the review practical. Install Tabbit Browser for a small test window, keep your original Chrome profile, and verify your important pages and extensions before moving the rest of your work.

FAQ
How do I find which Chrome tab is using the most CPU?
Open Chrome Task Manager with Shift+Esc on Windows, Linux, or ChromeOS, or use Window > Task Manager on macOS. Sort by CPU and watch the list while the slowdown happens, then match the highest named task to a tab, extension, or browser service.
Why does Chrome use high CPU when a video is playing?
Video decoding, page scripts, ads, captions, and an unavailable hardware decoder can all raise CPU use. Compare the same video with extensions disabled and check whether the GPU Process or the video tab changes when playback starts.
Can one Chrome extension cause high CPU usage?
Yes. An extension that watches page content or runs a background service can be the cause. Disable one suspect at a time, restart Chrome, and repeat the same actions so the comparison has a clear variable.
Is high CPU the same as high RAM usage?
No. CPU measures work being done now, while RAM measures data kept in memory. A page can use little RAM but run a busy script, or use lots of RAM while remaining mostly idle.
Should I turn off hardware acceleration to fix Chrome CPU use?
Not automatically. Turning it off can help with a graphics driver problem, but it can move video and rendering work onto the CPU. Test the same workload with the setting changed and restore it if playback, fan noise, or battery life gets worse.
Can Tabbit fix a Chrome process using too much CPU?
Tabbit cannot repair a faulty page, extension, codec, driver, or operating system. Its Smart Tab Organization can help you review a crowded session and close expired work, which is useful when many active tabs are the cause rather than one runaway task.